
Assignment 12
by
Jackson Huckaby
Working with Excel
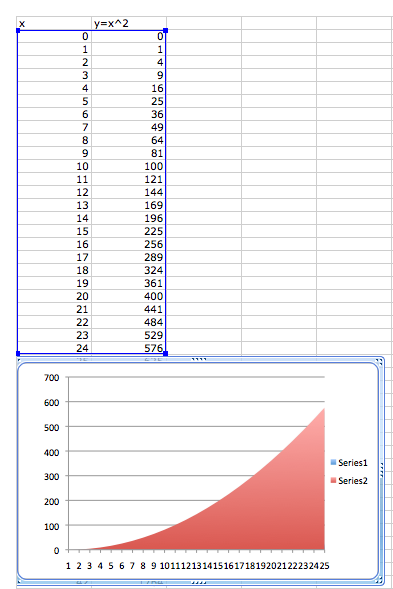
1. Construct a graph of any function y=f(x) by generating a table of values with the x values in one column and the y values in another.
The excel file can be found here.
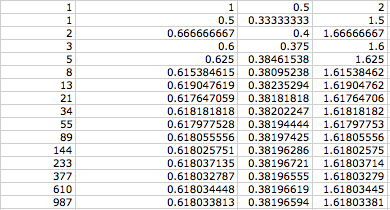
4. Generate a Fibonnaci sequence in the first column:
a. Construct the ratio of each pair of adjacent terms in the sequence. What happens as n increases? What about the ratio of every second term?
An excel sheet of this can be found here.
To better see what is happening to the ratios in the second column we can use excel to create a graph of the numbers.
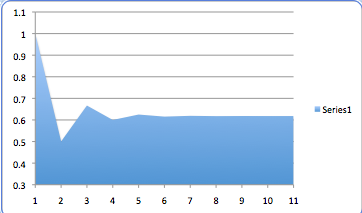
What we notice is that the value of the ratio is bouncing back and forth around a certain number. And as n increases the ratio gets closer and closer to this number. Looking at the 45th term we get a value of 0.618033989... more on this later.
Exploring the ratio of the every second term we follow the same procedure and discover that the ratio seems to be approaching approximately .38196601...
Next we can discover that if I take the ratio of the ratio for every term and the ratio for every second term, and proceed to make a ratio out of these two numbers. We get a ratio that, as n increases, approaches the Golden Ratio. This can be found here.
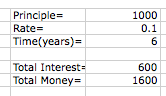
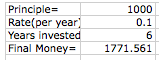
5. Explore problems of growth, e.g. savings, interest compounded.
An excel file to calculate simple interest by manipulating Principle, Rate, or Time can be found here.
To calculate compound interest click here.
Return home here.